Product Line
Showing 53–56 of 345 results
-

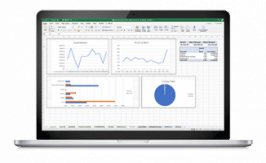
Core Data Analytics Module 10: Visualizations and Reporting
Course Description
This one-hour course introduces data visualization and reporting using Power BI and Microsoft® Excel®. Learn the benefits of using Power BI to create data visualizations, and see how Power BI differs from previous Excel® functions for visualizations. You will also work alongside the instructor to create a dashboard for journal entry testing. Dive into the relation among various tools for data analytics including: Power Query, Power Pivot, PivotTables, DAX formulas and storyboarding.
Learning Objectives
- Understand the applicable Excel® skills that will be required in making the transition to data analyst
- Understand what data visualization tools are available in Excel® and Power BI and how they are superior to previous Excel® tools.
- Apply skills to create a dashboard from journal entry testing data
- Apply skills to evaluate and present the output of analytical modeling in an easily interpreted form
- Learn to use the camera tool in Power BI to create dashboards
-

Core Data Analytics Module 2: Data Preparation Using Get and Transform
Course Description
In this one-hour course, you’ll learn to apply Power Query to extract, transform, and load data for analysis. You’ll also practice manipulating data and cleaning and transforming a basic general ledger.
Learning Objectives
- Understand the applicable Microsoft® Excel® skills that will be required in making the transition to data analyst
- Apply Power Query to extract, transform, and load (ETL) data
- Understand and apply the basics of data cleaning
- Understand what is M Code and how it is used
- Apply ETL processes to a dataset
-

Core Data Analytics Module 3: Formulas, Named Ranges, and Formula Accounting
Course Description
This one-hour course introduces table functions in Excel® and Power BI with specific focus on common formulas,functions and pitfalls in formula implementation. Users will work alongside the instructor to perform exercises as they apply and utilize named ranges and naming conventions to data.
Learning Objectives
- Understand the applicable Excel® skills that will be required in making the transition to data analyst
- Apply formulas to existing data and debug errors
- Understand and apply the basics of data cleaning
- Understand the importance of naming conventions in Excel® tables
- Understand the basic formula language and implementation guidance, and apply that guidance to common formulas used in data analytics
-

Core Data Analytics Module 4: Excel Tables
Course Description
In this one-hour course you will apply Excel® and Power BI tools and skills directly to tables in Excel®. Work alongside the instructor to create named tables, structure references, enter formulas and prepare the tables for input into Power Query. Then, learn about preparation of descriptive statistics, with emphasis on mean, median and standard errors.
Learning Objectives
- Understandapplicable Excel® skills required in transitioning to data analyst
- Apply these skills to create and structure tables
- Determine the appropriate descriptive statistics to present, and present them in a structured format
- Create structured references and understand their relation to formula creation
- Create formulas and apply troubleshooting techniques to formulas created

