Description
Course Description
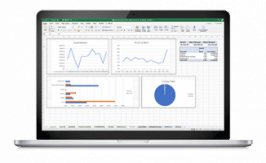
In this one-hour course you will apply Excel® and Power BI tools and skills directly to tables in Excel®. Work alongside the instructor to create named tables, structure references, enter formulas and prepare the tables for input into Power Query. Then, learn about preparation of descriptive statistics, with emphasis on mean, median and standard errors.
Learning Objectives
- Understandapplicable Excel® skills required in transitioning to data analyst
- Apply these skills to create and structure tables
- Determine the appropriate descriptive statistics to present, and present them in a structured format
- Create structured references and understand their relation to formula creation
- Create formulas and apply troubleshooting techniques to formulas created
Who Should Take This Course?
Auditors: Staff Auditors, Senior Auditors, Internal Auditors, Government Auditors
Accountants: Staff Accountants, Senior Accountants, Supervisors, Managers, Management Accountants
Analysts: Business Analysts, Financial Analysts

