Description
Course Description
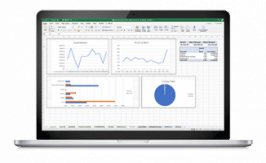
This one-hour course introduces data visualization and reporting using Power BI and Microsoft® Excel®. Learn the benefits of using Power BI to create data visualizations, and see how Power BI differs from previous Excel® functions for visualizations. You will also work alongside the instructor to create a dashboard for journal entry testing. Dive into the relation among various tools for data analytics including: Power Query, Power Pivot, PivotTables, DAX formulas and storyboarding.
Learning Objectives
- Understand the applicable Excel® skills that will be required in making the transition to data analyst
- Understand what data visualization tools are available in Excel® and Power BI and how they are superior to previous Excel® tools.
- Apply skills to create a dashboard from journal entry testing data
- Apply skills to evaluate and present the output of analytical modeling in an easily interpreted form
- Learn to use the camera tool in Power BI to create dashboards
Who Should Take This Course?
Auditors: Staff Auditors, Senior Auditors, Internal Auditors, Government Auditors
Accountants: Staff Accountants, Senior Accountants, Supervisors, Managers, Management Accountants
Analysts: Business Analysts, Financial Analysts

